|
Listen to this Article (Audio)
|

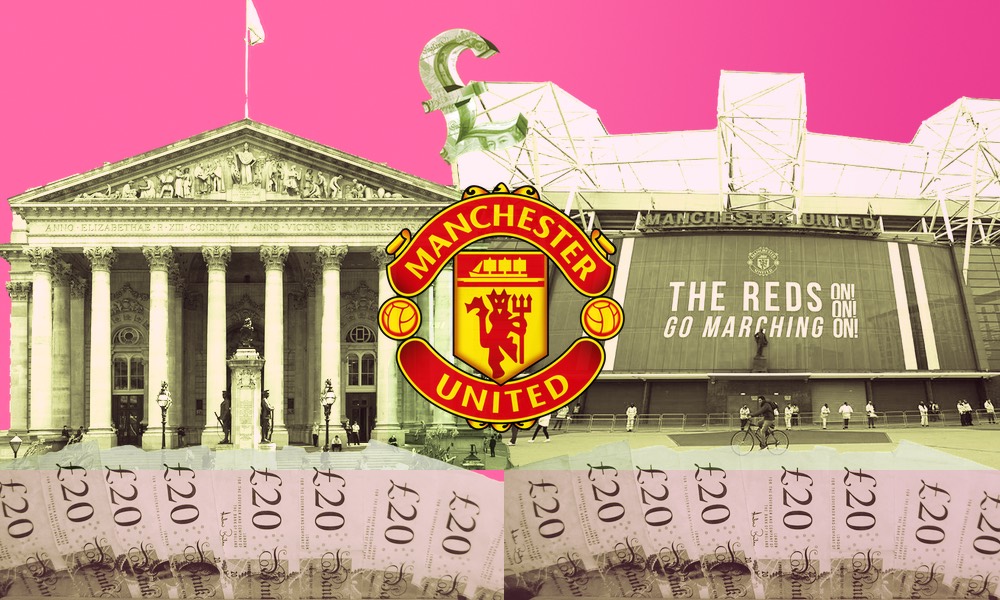
Manchester United Total Expenditure vs Revenue 2022
| Revenue | Expenditure | Net | Total Debt |
| £582.81m | £573.06m | £9.75m | £530.2m |
Source: FIFA, UEFA, England FA, Ofgem, HMRC, Sponsorlytix
Source: FIFA, UEFA, England FA, Ofgem, HMRC, Sponsorlytix
 Total Expenditure | £573.06m
Total Yearly Expenditure Breakdown
Most of Manchester United expenses, just like any other football club in the world, comes from player salaries (payroll). Here is how football clubs spread their expenditure:
- Player Payroll
- Player Transfers
- Executive Staff Payroll
- Debt Payments
- Agent Fees
- Marketing Costs
- Transportation costs
- Stadium Costs
Player Payroll:
Manchester United spends a total of £295.20 million on players annual payroll as of fiscal year ending June 30, 2022, and £59,041,000 in annual taxes. Players making up to £50,270 per year are subject to 20% tax rate, which is also known as the basic tax rate. Taxes on income over this threshold are 40%. (higher rate). The extra rate is another name for the third tax bracket. Any income over £150,000 is subject to a 45% tax rate.

Manchester United Players Payroll Breakdown
| Weekly Payroll | Average Weekly Payroll | Annual Payroll | Average Yearly Payroll | Income Tax |
| £4,541,615 | £130,090 | £295,200,000 | £6,764,685 | £59,041,000 |
Source: FIFA, UEFA, England FA, HMRC, Sponsorlytix
Source: FIFA, UEFA, England FA, HMRC, Sponsorlytix

Manchester United Players Payroll
| Player Name | Payroll (Yearly) | Payroll (Weekly) |
| Cristiano Ronaldo | £26,800,000 | £515,385 |
| David De Gea | £19,500,000 | £375,000 |
| Jadon Sancho | £18,200,000 | £350,000 |
| Raphael Varane | £17,680,000 | £340,000 |
| Carlos Casimiro | £15,600,000 | £300,000 |
| Anthony Martial | £13,000,000 | £250,000 |
| Bruno Fernandes | £12,480,000 | £240,000 |
| Marcus Rashford | £10,400,000 | £200,000 |
| Harry Maguire | £9,875,000 | £189,904 |
| Christian Eriksen | £7,800,000 | £150,000 |
| Luke Shaw | £7,800,000 | £150,000 |
| Frederico de Paula Santos | £6,240,000 | £120,000 |
| Victor Lindelof | £6,240,000 | £120,000 |
| Lisandro Martínez | £6,240,000 | £120,000 |
| Donny van de Beek | £6,240,000 | £120,000 |
| Aaron Wan-Bissaka | £4,680,000 | £90,000 |
| Mason Greenwood | £3,900,000 | £75,000 |
| Phil Jones | £3,900,000 | £75,000 |
| Brandon Williams | £3,380,000 | £65,000 |
| Scott McTominay | £3,120,000 | £60,000 |
| Axel Tuanzebe | £2,600,000 | £50,000 |
| Tom Heaton | £2,180,000 | £41,923 |
| Amad Diallo | £1,500,000 | £28,846 |
| Diogo Dalot | £1,300,000 | £25,000 |
| Tahith Chong | £1,040,000 | £20,000 |
| Facundo Pellistri | £1,000,000 | £19,231 |
| James Garner | £880,000 | £16,923 |
| Anthony Elanga | £470,000 | £9,038 |
| Teden Mengi | £180,000 | £3,462 |
| Tyrell Malacia | £6,240,000 | £120,000 |
| Loan | ||
| Dean Henderson | £5,200,000 | |
| Alex Telles | £4,840,000 | |
| Eric Bailly | £4,160,000 | |
| Amad Diallo | £1,500,000 | |
| Álvaro Fernandez | £1,500,000 |
Source: FIFA, UEFA, England FA, Sponsorlytix
Source: FIFA, UEFA, England FA, Sponsorlytix
Player Transfers: Manchester United spent a total of £230.37 million on player arrivals in the summer (2022/23) and generated a total of £26 million on departures. Ending the summer transfer window with a -£204.37 million net.
Premier League teams spent a total of £1.9 billion on gross transfers during the summer 2022 transfer window, which is by a margin of £487.8 million the largest amount ever recorded during a single transfer window.
Manchester United spent a total of £2.13 billion on player arrivals in their all time Premier League transfers expenditure (1992/93 to 2022/23), taking in an income of £729.2 million with a net of -£1.4 billion.

Manchester United All Time Premier League Players Transfers
| Expenditure | Arrivals | Income | Departure | Balance | Season 22/23 Net |
| £2.13b | 520 | £729.29m | 519 | £-1.4b | £-204.37m |
Source: FIFA, UEFA, England FA, Sponsorlytix
Source: FIFA, UEFA, England FA, Sponsorlytix
Executive Staff Payroll: The best paid directors of Premier League football teams make far more money than the highest paid directors at comparable-sized non-football businesses. The average chief executive remuneration in the UK is £215,879. Manchester United pays in the region of £4.3 million to their directors and executive staff each year.
Debt Payments: Manchester United has a total of £530.2 million in debt on their books and shell out £21.2 million on yearly payments (including interest).
Stadium Costs: A 90-minute match uses up to 25,000 KWh of electricity. As per the current Ofgem rates, Electricity costs £0.52 per kWh + Daily standing charge: £0.46 and Gas costs £0.15 per kWh + Daily standing charge: £0.28. It costs Manchester United approximately 28000 Khw on average per home game, that is£19,030.1 per game and£361,571.9 per season.
Agent Fees: The 20 Premier League teams managed to pay agents £272.6 million this transfer window, despite all the discussion that football must cut back on its expenditures on transfer fees and wages in light of the financial calamity brought on by the epidemic. Manchester United paid £29.03 million in agent fees for their transfer business.
Marketing Costs: Manchester United offers a variety of officially-licensed goods with the AFC Bournemouth name and logo, from bed coverings to coffee cups apart from the marketing and promotions of the season tickets, hospitality and official kits, the club spends on marketing through social media, outdoor advertising and through local, national and international news publications. Manchester United spends on average £15 million on marketing.
Transportation Costs: For the fiscal years ended June 30, 2022, Manchester United spent approximately £3.6 million on transportation costs, which includes pre-season preparations and logistics and all of the Premier League, Cups and UEFA competition away games.

Manchester United Total Expenditure
| Executive Staff Payroll | Total Debt | Debt Payments | Stadium Costs | Agent Fees | Marketing Costs | Transportation Costs | Annual Payroll | TOTAL |
| £4.3m | £530.2m | £21.2m | £0.36m | £29.03m | £15m | £3.6m | £295.20m | £573.06m |
Source: FIFA, UEFA, England FA, Ofgem, HMRC, Sponsorlytix
Source: FIFA, UEFA, England FA, Ofgem, HMRC, Sponsorlytix
Total Revenue | £582.81m
Total Yearly Revenue Breakdown
Manchester United monetize’s its worldwide brand through the usual four income sources under the Commercial revenue sector:
- Sponsorship
- Matchday Revenue
- TV Rights Distribution
- Retail, Merchandising, Clothing & Product Licensing
Sponsorship: Through partnerships with top national and international brands and businesses throughout the world, Manchester United monetizes the value of the clubs worldwide brand and fan base. For the fiscal years ended June 30, 2022, Manchester United generated sponsorship revenues of £192.5m.

Manchester United Sponsorship Revenue
| Sponsor Name | Amount (per year) | Contract Duration | Placement |
| Team Viewer | £47.5m | 2021 – 2026 | Main Sponsor (Front of shirt) |
| Adidas | £75m | 2015 – 2025 | Kit Supplier |
| DXC Technology | £12m | 2022-2025 | Sleeve Sponsor |
| Tezos | £20m | 2022-2025 | Training Kit |
| Apollo Tyres | £2m* | not reported | Partner |
| Betfred | £2m* | not reported | Partner |
| Cadbury | £2m* | not reported | Partner |
| Canon | £2m* | not reported | Partner |
| Casillero de Diablo | £2m* | not reported | Partner |
| Chevrolet | £2m* | not reported | Partner |
| Chivas | £2m* | not reported | Partner |
| DHL | £2m* | not reported | Partner |
| Ecolab | £2m* | not reported | Partner |
| Kohler | £2m* | not reported | Partner |
| Konami | £2m* | not reported | Partner |
| Marriott | £2m* | not reported | Partner |
| Maui Jim | £2m* | not reported | Partner |
| Melitta | £2m* | not reported | Partner |
| Mlily | £2m* | not reported | Partner |
| Remington | £2m* | not reported | Partner |
| Snapdragon | £2m* | not reported | Partner |
| Therabody | £2m* | not reported | Partner |
| Visit Malta | £2m* | not reported | Partner |
| Total | £192.5m |
*Estimated as per market standards and BV and EMV reach of Manchester United Football Club | Source: Sponsorlytix
*Estimated as per market standards and BV and EMV reach of Manchester United Football Club | Source: Sponsorlytix
Matchday Revenue: For the fiscal years ended June 30, 2022, Manchester United generated a total combined Matchday Revenues of £95.29 million, including £75.24 million from the English Premier League, £3.86 million from the FA Cup, £0.35 million from the Carabao Cup and £15.84m from UEFA Champions League.
In each of the past 21 years, Manchester United have averaged over 99% of Premier League match capacity. Due to the amount of home games played and the success of our first team in various tournaments, matchday income will change from year to year.

Manchester United Matchday Revenue
| Average Attendance | Average Matchday Income / Game | Average Matchday Income / Season |
| Premier League | ||
| 74,498 | £3.96m | £75.24m |
| FA Cup | ||
| 74,498 | £0m | £3.86m |
| Carabao Cup | ||
| 74,498 | £0m | £0.35m |
| Champions League | ||
| 74,498 | £3.96m | £15.84m |
| Total | £95.29m |
Source: UEFA, England FA, Sponsorlytix
Source: UEFA, England FA, Sponsorlytix
TV Rights Revenue (Broadcasting)
The money the club makes from the sale of live football content benefits the club directly, and it also helps the business partners indirectly by giving them more worldwide visibility. The global television rights for the Premier League, UEFA club competitions, and other competitions provide cash for broadcasting.
Additionally, more than 100 nations and territories across the world receive Manchester United programming through the English Premier League TV Rights Distribution sales and also the in house club channel and official mobile app.
As a result of fluctuations in the amount of prize money available and the success of the first team in such contests, broadcasting income, including, in certain circumstances, prize money received in respect of such competitions, will change from year to year.
For the fiscal years ended June 30, 2022, Manchester United generated a total combined TV Rights Revenues of £188.92 million, including £149.8 million from the English Premier League, £0.49 million from the FA Cup, £0.03 million from the Carabao Cup and £38.6 million from UEFA Europa League.

Manchester United TV Rights Revenue
| Manchester United | £188.92m | ||||
| Premier League | Equal Share | Facility Fees | Merit Payment | Commercial Revenue | Total |
| £79m | £25.4m | £39.8m | £5.6m | £149.8m | |
| FA Cup | Prize Money | TV Fees | Total | ||
| £67.5k | £432k | £0.49m | |||
| Carabao Cup | Prize Money | TV Fees | Total | ||
| £0 | £32k | £0.03m | |||
| Champions League | Performance Share | Market Pool | Total | ||
| £18.2m | £20.4m | £38.6m |
Source: FIFA, UEFA, England FA, Sponsorlytix
Source: FIFA, UEFA, England FA, Sponsorlytix
Retail, Merchandising, Apparel & Product Licensing: Manchester United on average sells 2.55 million units of the official kit (home & away). The club’s retail, merchandising, garment, and product licencing for the fiscal years ended June 30, 2022 sales were £106.1 million. On a global scale, the club promotes and markets sportswear, workout and leisure wear, and other goods bearing the Manchester United name.
In addition, Manchester United offers a variety of other officially-licensed goods with the Manchester United name and logo, from bed coverings to coffee cups. These goods are supplied via the wholesale distribution networks of club partners as well as retail locations bearing the Manchester United logo and online shopping portals.

Manchester United Retail, Merchandise, Apparel & Product Licensing Revenue
| £106.1m |
Source: Sponsorlytix